MISP practical guide
MISP Feed Overlap Analysis Matrix: How to Compare Feeds

A threat intelligence feed is a regularly updated list of indicators: malicious domains, URLs, IP addresses and file hashes that your security tools can watch for. Every feed requires storage, processing time and analyst attention, even when the feed itself is free. Comparing feeds helps you assess whether another source adds different indicators or useful context about indicators you already receive.
Counting indicators won’t tell you which feeds repeat each other. A large feed may contain many of the same domains, URLs or IP addresses you already receive, while a smaller one may cover threats your current sources miss.
MISP’s Feed overlap analysis matrix gives you a starting point. It compares feeds in pairs and shows how much of one feed also appears in another. This guide explains how to read it, then walks through a real comparison of PrecisionSec’s commercial feed with CIRCL OSINT Feed, Botvrij.eu, Rösti, Rectifyq and TweetFeed.
Key takeaways
- The MISP Feed overlap analysis matrix compares the indicator values cached in MISP for two feeds at a time, helping you spot sources that repeat the same data.
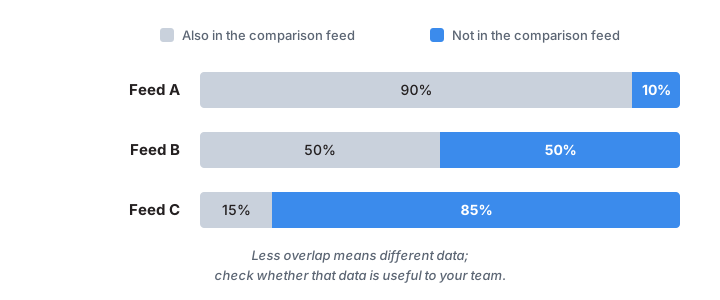
- Each percentage is based on the feed in the row. A cell showing 2% means about 2 in every 100 of that feed’s cached values also appear in the feed named at the top of the column.
- Reversing the comparison can change the percentage because the feeds may contain different numbers of values, even though they share the same matching values.
- Low overlap means fewer shared values, so check whether the additional indicators are relevant and useful to your team. A feed with high overlap may still provide better context or earlier delivery.
Want to run this on your own MISP? Jump to setting up the comparison.
How to read the matrix
A value is the actual domain name, URL, IP address or file hash recorded as an indicator. Each row identifies the feed you are measuring, while each column identifies a feed you are comparing it against. The percentage where they meet tells you how much of the row feed also appears in the column feed. Labels such as F111 identify feeds on that MISP instance; your instance may assign different IDs.
Read each cell as:
What percentage of the row feed’s values also appears in the column feed?
The overlap percentage is calculated as:
overlap percentage = 100 × shared values / total distinct cached values in the row feedEach different value is counted once within a feed’s cache, even if it appears in several events.
For example, suppose Feed A contains 1,000 distinct cached values and Feed B contains 10,000, with 20 values appearing in both. Those shared values make up 2% of Feed A but only 0.2% of Feed B, which MISP displays as 0% after rounding.
Two details are worth knowing:
- Rounding. MISP rounds to a whole percentage, so a 0% can hide a small overlap (anything under 0.5%).
- The dash. The diagonal dash means MISP skips comparing a feed with itself.
A real example: PrecisionSec and five other feeds
The screenshot below compares PrecisionSec’s commercial feed with five public sources.
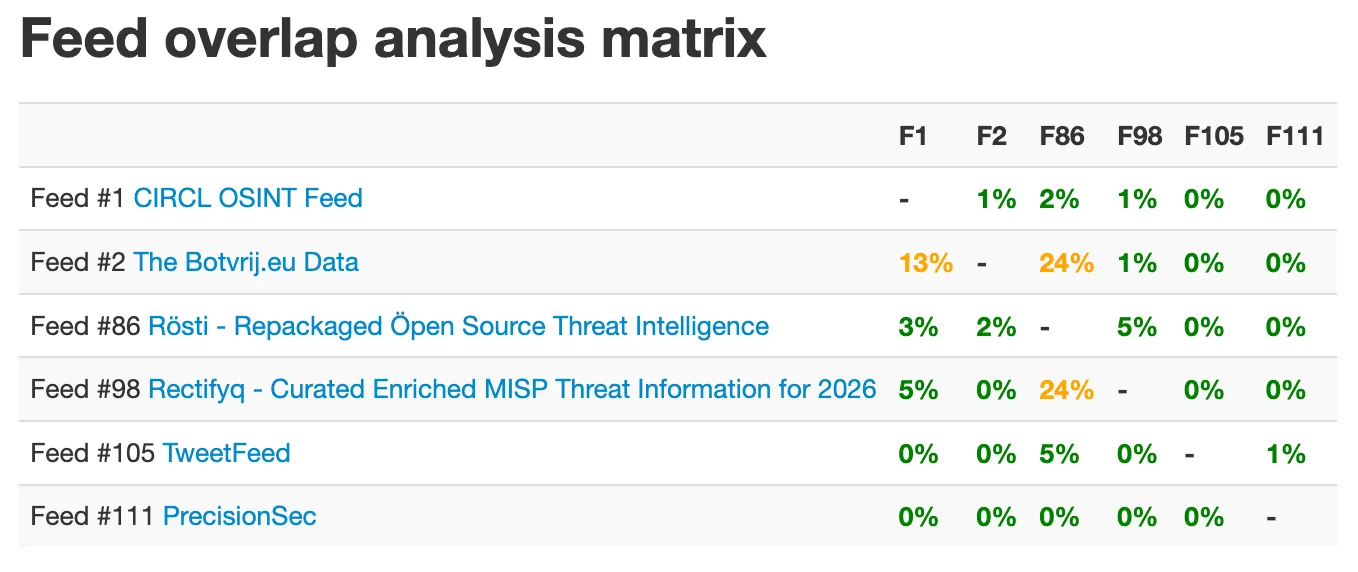
This screenshot shows the cached data from one MISP instance at one point in time. The feeds may have been cached at different times and may cover different periods, so these percentages should be treated as an example rather than a controlled comparison.
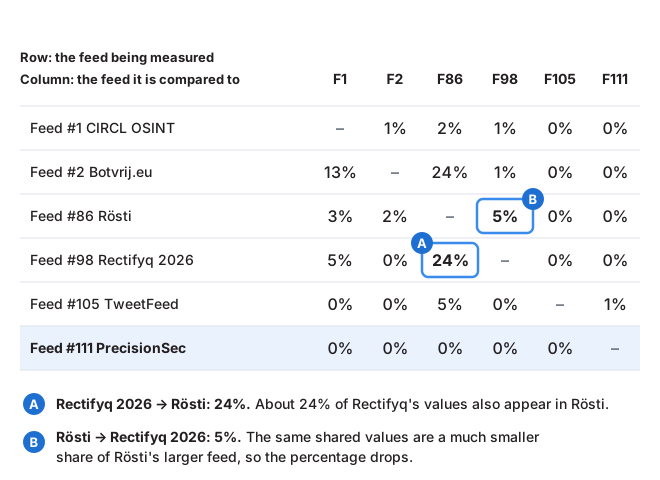
Find Feed #111 PrecisionSec in the bottom row and read across. Every cell shows 0%, so less than half a percent of PrecisionSec’s values also appear in CIRCL OSINT, Botvrij.eu, Rösti, Rectifyq or TweetFeed.
To read the comparison in the other direction, follow the F111 column down. TweetFeed → PrecisionSec shows 1%, and the other four show 0%.
The public feeds overlap with each other more than they do with PrecisionSec, but most cells are still small. The exceptions show why direction matters. Rectifyq 2026 → Rösti shows 24%, while Rösti → Rectifyq 2026 shows 5%. The same shared values make up a quarter of the smaller Rectifyq feed but only a small share of Rösti’s larger one. Botvrij.eu → Rösti (24%) and Rösti → Botvrij.eu (2%) work the same way. Always check both the row and the column before quoting a result.
Overall, the large majority of PrecisionSec’s values do not appear in these five feeds. That tells you the data is different, not that it is useful. It doesn’t prove the feed is better, or that every extra value will help your team.
The next check is whether you can act on the values that differ. Open an event from each feed you are comparing and look at the context around its indicators. PrecisionSec’s MISP events link malware samples, delivery infrastructure, command-and-control endpoints and campaigns, and MISP’s Event Graph lets you follow those links from a single indicator. This event for WarzoneRAT shows three command-and-control domains connected to the malware samples that communicate with them:
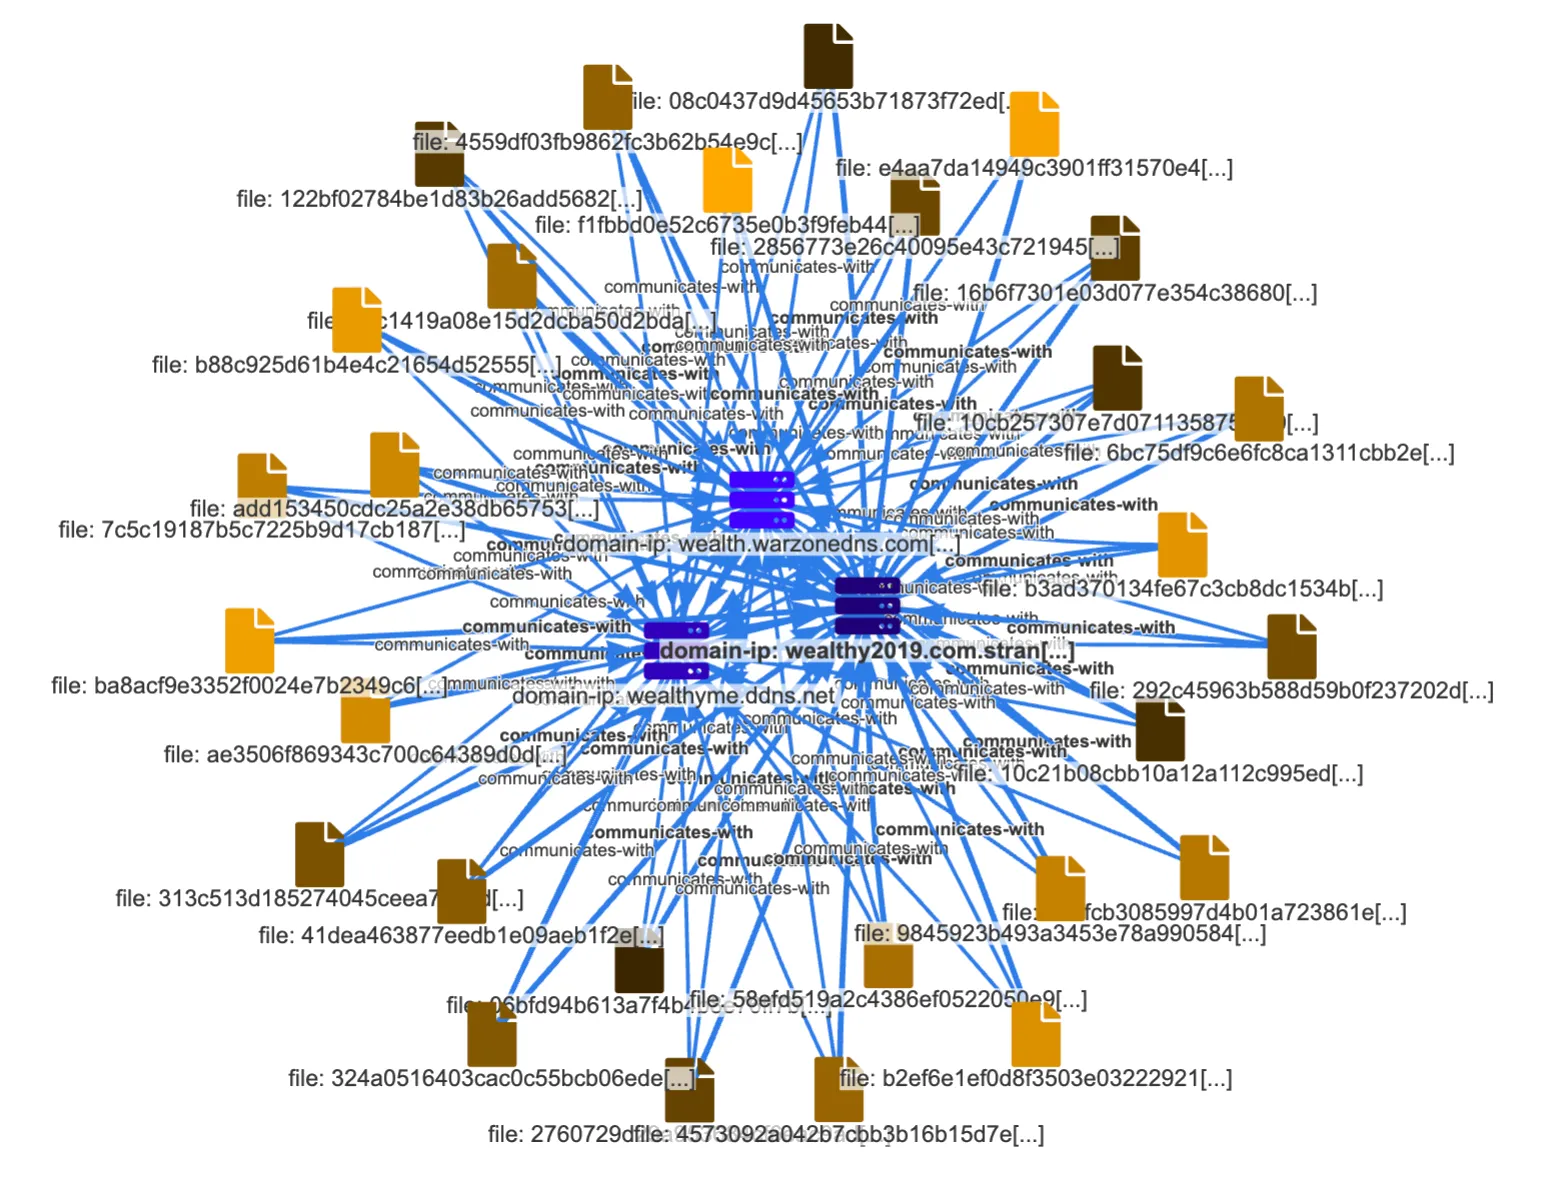
Event Graph for a WarzoneRAT event in the PrecisionSec MISP feed.
Events for some malware families also include configuration data extracted from the samples, such as command-and-control servers and the Ethereum RPC endpoints this Remus Stealer sample uses:
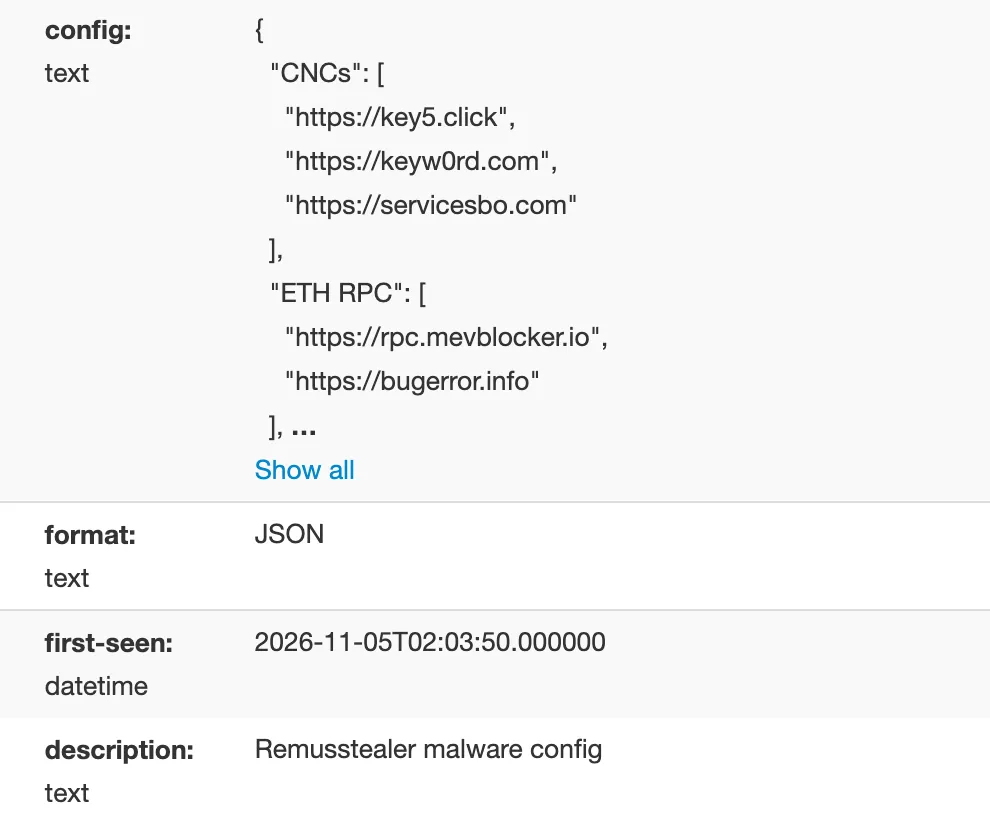
Extracted malware configuration from a Remus Stealer event, truncated by MISP’s collapsed view.
Compare what each feed gives you for the same kind of threat. Can you pivot to related activity without stitching separate records together?
Set up the comparison in your MISP
This walkthrough was tested on MISP 2.5.44.
Start with the feeds you already use and the feed you want to evaluate. For PrecisionSec’s paid or trial feed, follow the MISP feed setup guide with your supplied credentials.
Configuring and caching feeds requires a site administrator account. If you use MISP as an analyst, ask your site administrator to prepare the feeds before you review the matrix.
The matrix compares each feed’s cache: a local copy of its values that MISP keeps for lookups and comparison, without importing them as events. Prepare the caches like this:
-
Open the feeds list at
/feeds/index. In the interface shown here, you can reach it through Sync Actions → List Feeds. -
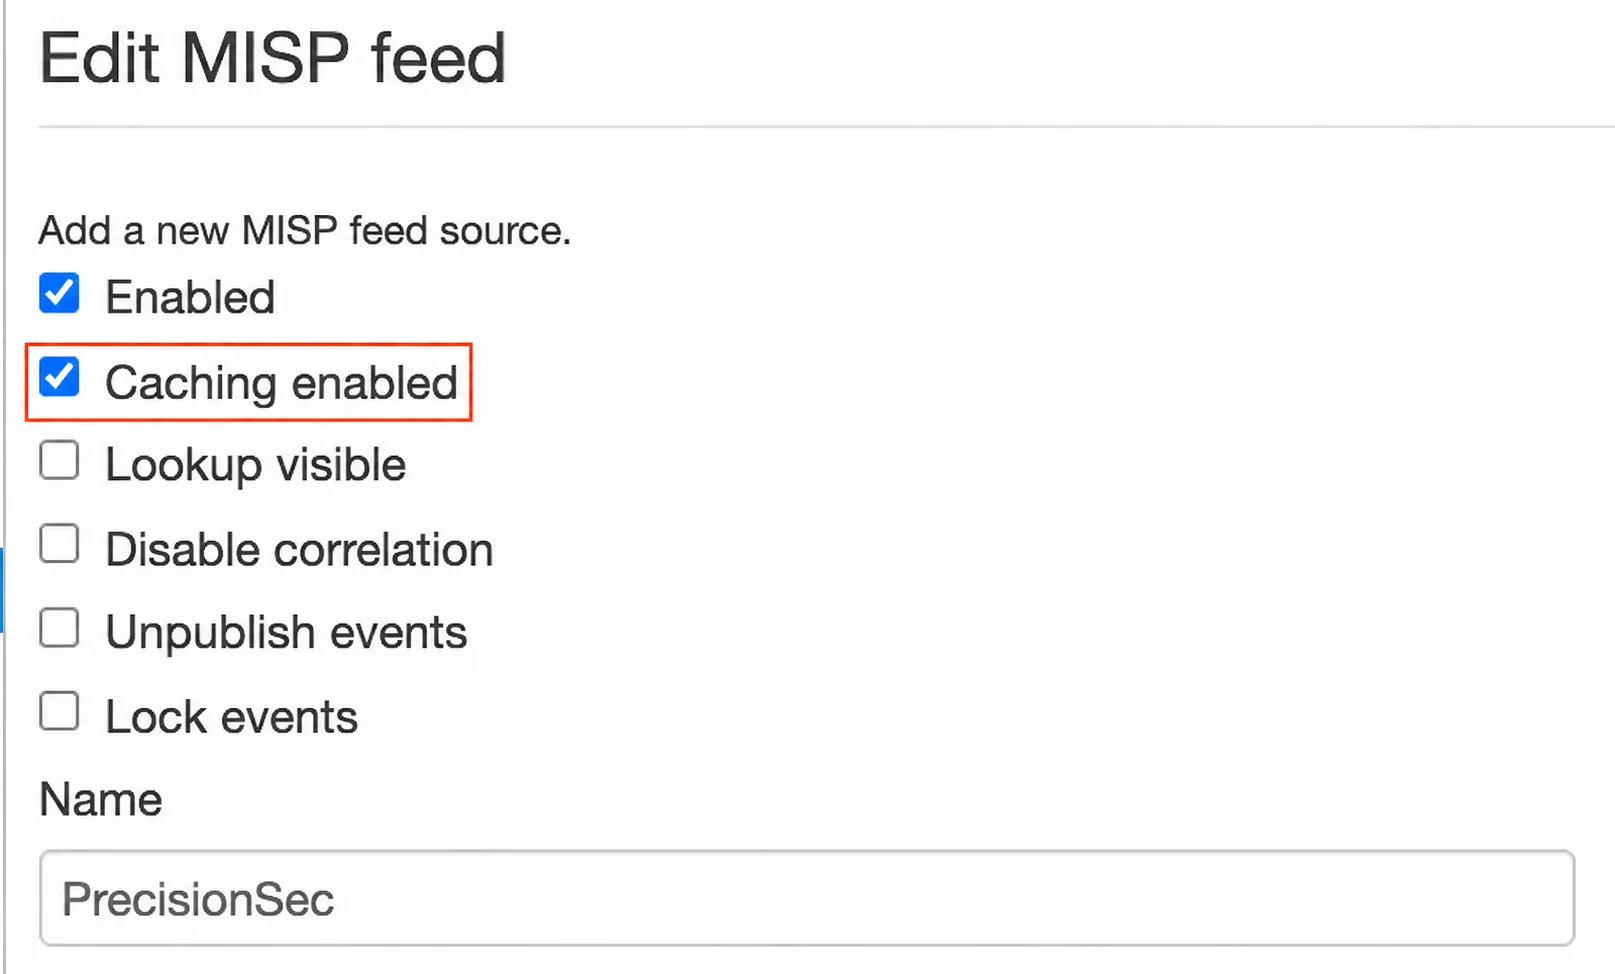
Edit each source you want to compare, turn on Caching enabled, and save.
-
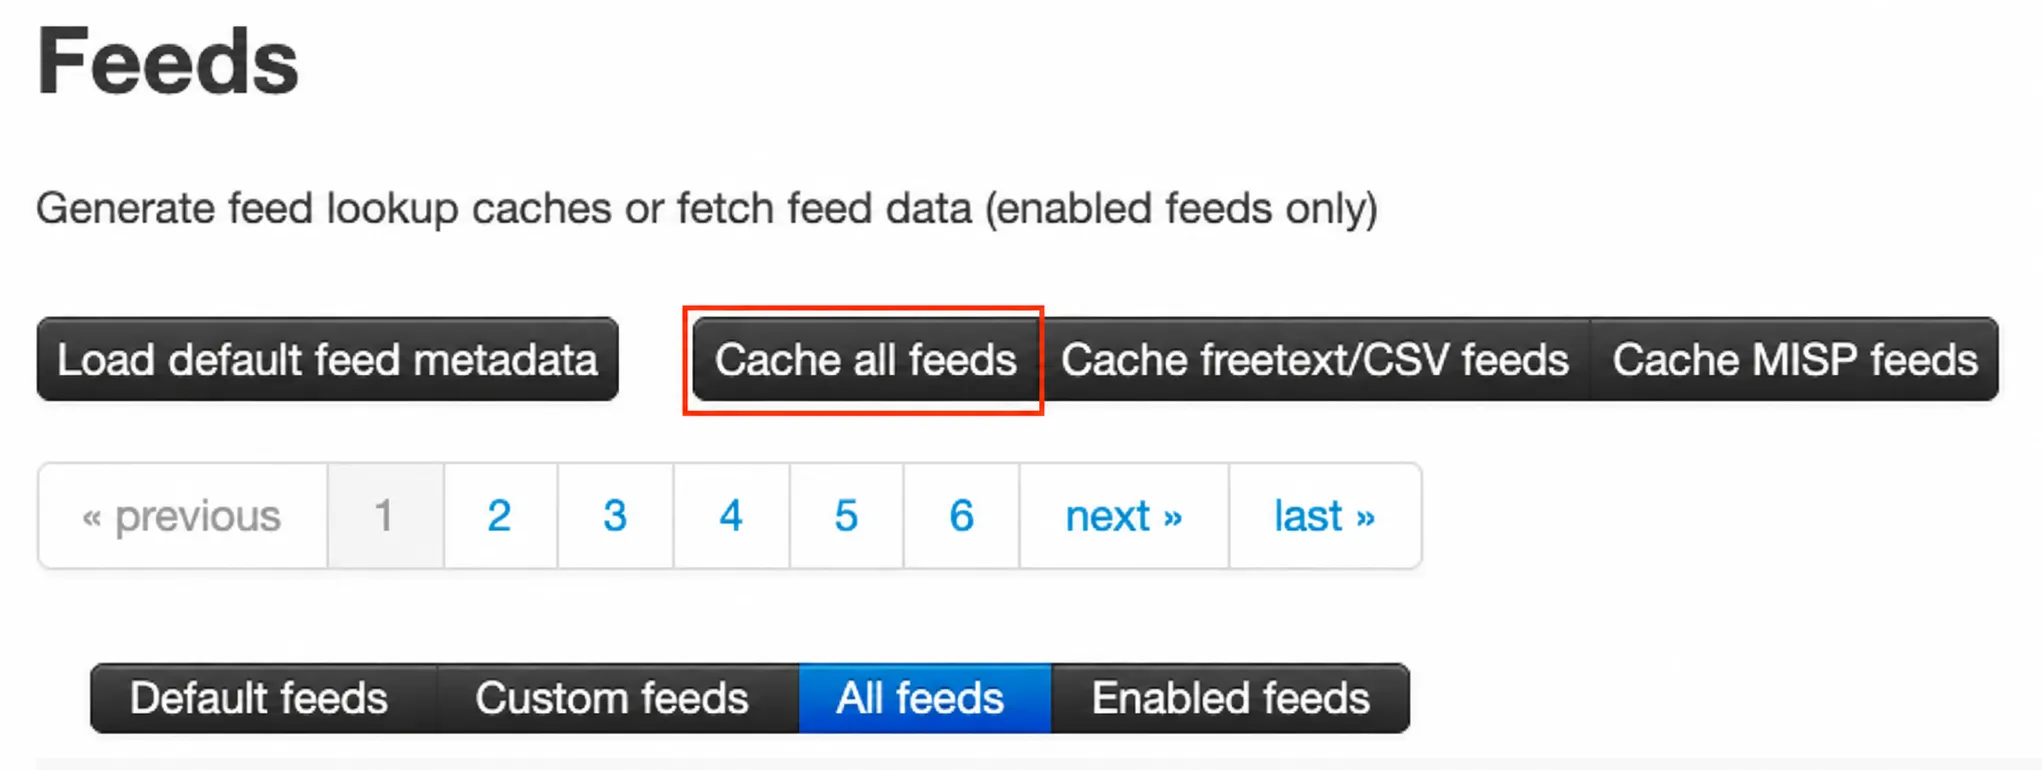
Return to the feeds list and click Cache all feeds above the table to populate or refresh the feed caches. This is a bulk caching action.
-
Wait for caching to finish. If it runs as a background job, check the result at
/jobs/index. Then refresh the feeds list and check the cache ages in the Caching column. Refresh older caches before drawing conclusions.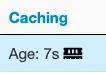
PrecisionSec feed cache age: 7 seconds.
-
Open Feed overlap analysis matrix from the feeds menu, or go to
/feeds/compareFeedson your instance.
A feed’s Enabled setting is separate from caching and controls whether its data can be imported as local events. You don’t need to import every feed for this exercise. See the MISP feed management guide for version-specific controls.
If a source is missing from the matrix, check that caching is enabled and has completed successfully. Ask your site administrator to review the feed’s Lookup visible setting, which controls whether other users can see its lookup results, alongside your account’s permissions. A missing or failed cache does not mean zero overlap.
Turn overlap into an evaluation decision
When overlap is low, sample the indicators that differ and check whether your team can use them. For example, a feed dominated by file hashes may offer limited benefit if your investigation tools mainly collect DNS logs. Look for enough supporting information to understand the indicator and decide how to investigate it.
When overlap is high, check whether the feed provides useful information about the shared indicators, such as malware-family labels, links to related activity or confidence assessments. Earlier delivery of the same indicators may also make a feed valuable.
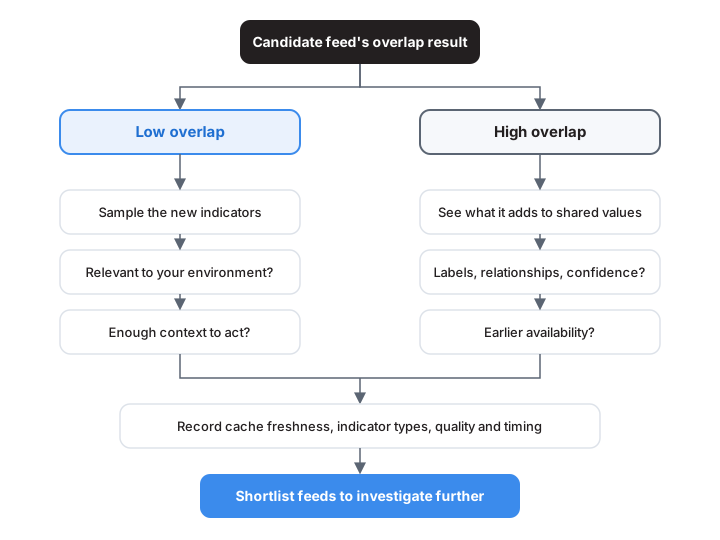
Before deciding, record these details:
- Cache freshness and history. Refresh the sources close together and note their cache times. Check how much historical data each feed keeps: a feed containing years of data covers a different period from one containing only the most recent days or weeks.
- Indicator types. One percentage can hide differences between network indicators and file hashes. Inspect the feed contents to see the mix.
- Relevance and quality. Check whether the extra indicators are valid, include enough supporting information to investigate and can be used by your detection and investigation tools.
- Timing. If speed matters, measure when each provider makes indicators available. An attribute’s
first_seensays when something was observed, not when the feed delivered it to you. MISP’s timestamp guide explains the difference.
The matrix compares two feeds at a time. Because the same value can appear in several feeds, adding the percentages can count that value more than once. To measure what the feed you are evaluating adds beyond all your existing feeds, you need to compare it with one combined list of their values, with duplicates removed. The pairwise matrix can’t show you that figure.
The practical outcome is a shortlist of feeds to investigate further, with a clear account of what overlaps and what needs closer review.
Try it with your own feeds
Request a 15-day PrecisionSec trial and compare the MISP feed inside your own instance. Prefer to start with something free? Add our free MISP feed, which includes the event relationships and extracted malware configurations shown above, and see how it overlaps with what you already have. Your percentages may differ from the commercial feed (F111) in the example above.